Tinking around today; bringing the atomic data into the Phi method that I’ve developed.
What you’re looking at here is 95 atoms.
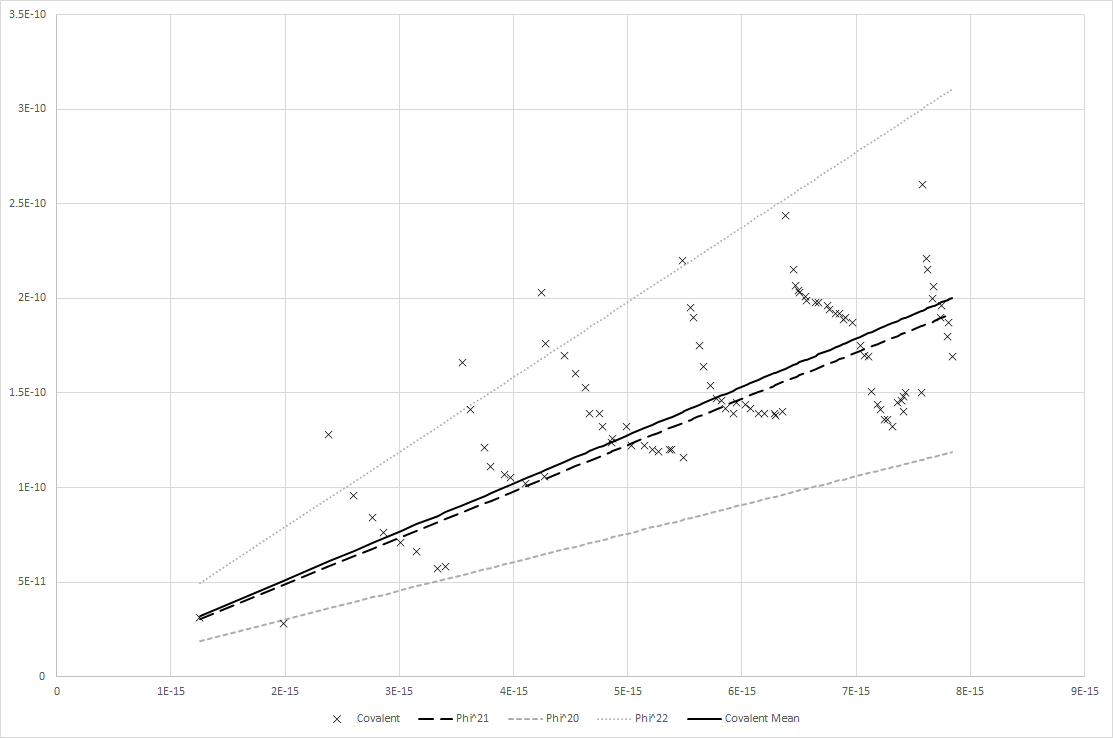
What’s plotted is their Covalent Bond Radii (Y axis) cross sectioned according to their Nuclear Radii (radius of nucleus - X axis).
The X’s are plot points of each actual atom’s real values (or, rather, to be very specific, the cataloged Covalent Bond Radii and the calculated Nuclear Radii given the formula R=r0A^1/3 - the standard formula for determining the radius of the nucleus, where A is the atomic mass, r0 is the radius of nucleons…protons and neutrons…approximately 1.25 to 1.3 fm - read more here if you want https://earthphysicsteaching.homestead.com/Calculation_of_Nuclear_Radius.pdf).
So I have 95 nuclear radii and covalent bond radii.
I then divide the nuclear radii by the covalent bond radii to find what the percent is that the nucleus’ radius is of the covalent bond radius of the same atom.
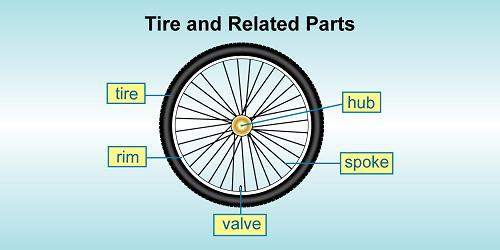
Think of this like asking what percent the hub radius is of the total wheel radius on a bicycle.
Next, I then take these values and find the mean (that is, the average).
This tells me the average percent a nucleus’ radius will account for of its covalent bond radius.
As an average, it’s going to be wrong if you apply it to a specific sample. Because it’s a sample average.
Anyway, next, I then turn back around and calculate the covalent bond of each atom given the following formula.
Rcov = Rnuc*Phi^21
What this means is that I take a nucleus’ radius and multiply it by Phi (which is calculated by (sqrt(5)+1)/2 … or, 1.618 etc… ) to the power of 21.
So, firstly, Phi to the power of 21. And then multiply the nucleus by this value.
Why Phi^21?
I’ll get to that later.
Anywho.
So, this equation’s results are plotted as the large dashed black line.
Using Phi^22 and Phi^20 are also plotted using different dotted and dashed lines, respectively.
This kind of shows a perspective - a sort of Maximum and Minimum; so that we can see if Phi^21 serves the optimal middle of the road.
What this chart basically shows is that running the atoms across Phi^21 creates an almost identical line to the mean of the relationship between the nuclear and covalent bond radii.
In fact, if you take the mean and apply it back on all samples of the atoms to calculate covalent bond radii, and then take that value and divide it by the real covalent bond radius, you now have the amount of difference by factor that the method of applying the mean produces from the actual value.
Now, if you take the Phi^21 produced covalent bond radii and divide it by the actual covalent bond, you again, have the amount of difference by factor that this method creates from the actual value.
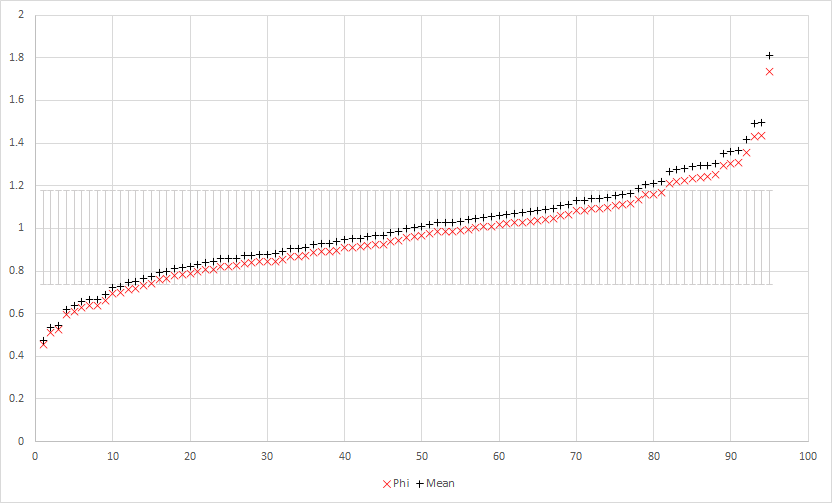
When you compare these two method’s differences by factors per sample against each other, you get this:
The grey bars in the middle around 1 represent one standard deviation.
Meaning, calculating by Phi^21 is effectively equivalent to calculating by the sample mean of the 95 atoms.
In fact, it’s almost impossible to tell the difference.
If you run a Pearson Correlation (i.e. a comparison of the linear correlation between two sample sets of data) between the Mean produced values and the Actual values, you’ll get the result: 0.698802
That means, not very tightly related…which is easily seen when you look at that first graph where you see X plot points all over the place, and the mean (solid black line) right down the middle which doesn’t look very tightly locked in with the shotgun blast of X plots everywhere.
So that makes sense. As noted, the mean from a sample group isn’t going to lock-step with each sample very tightly in many cases. This is why you usually see things like +/- after an average or mean, because there’s a deviation that has to be calculated…in this case, the standard deviation is 9.00289 X 10^-06, which is substantial when you’re mean is 3.91635 X 10^-05.
If I moved that to numbers we’re all more familiar with seeing, then it would be like having the mean equal 100 and the deviation be 23. So almost a quarter of the value in wavering up and down all over the place.
Again, not all that tightly correlated, but that doesn’t much matter. We know this is going to happen because it’s a mean of the sample group.
However, back on track, what is remarkable is this.
When you run the Pearson Correlation between the Phi^21 produced values and the Actual values, you also get the result: 0.698802
In, fact.
You don’t just get 0.698802 on both. You get exactly 0.698801854844335 on both
Which is unreasonably functional. It effectively means that you can determine the mean of the relationship between the radii of the nucleus and covalent bond by nothing more than multiplying the nucleus radius by Phi^21.
This also just happens to be the same value that does the same thing (like, right down to the whole bit about the mean and everything) with Astrosphere radii in comparison to the relationship with the Stars’ radii.
And, it also happens to be the same set R x Phi^0, R x Phi^1, R x Phi^3, … R x Phi^21 (where R is the radius of a star) which generates an exponential line that will average an R^2 value of 0.98 +/- 0.013 of Semimajor Axes of Planets in main sequence star systems (R^2 is a value to determine how well fitting an exponential line is to plotted data - normally used to determine if a trend line is best representing the data … … … semimajor axis is a consolidated mean of a planet’s orbital distance from its star).
In other words…
A source’s radius multiplied by Phi to the power of n (where n is some number from 0 to … so far 21) seems unreasonably good at punching out a rough ballpark region of propagation for some given counterpart to the source.
Imagine, for a moment, if you could take the radius of a tree’s trunk and multiply it by Phi^21 to know the rough radius of its outer-most reach of its branches.
And then imagine that you could do the same thing for the radius of the rings caused by a pebble dropped in water.
That’s the kind of oddity that this is.
Now, it doesn’t do anything. It doesn’t say anything meaningful about physical mechanics. It’s strictly the a numerical analysis and that’s all.
A neat numerical coincidence. A really neat number coincidence, but that’s it. It’s not some mechanical rule of nature.
This was something that I found by accident. Originally, I found the odd relationship between atoms and stars because I wanted a baseline for the astrosphere catalog and a sample size of 21 stars is hardly substantial enough to draw a mean off of and create a baseline from it.
So, I figured, what the hell. I’ll use atoms’ relationship between their nucleus and covalent bond to create the baseline and even though it’ll be off, it’ll be uniformly off and that’ll at least be something.
Then I found, to my surprise, that atoms and the sample of stars I had shared a very similar mean (it was something like 0.0040% to 0.0037% originally).
Then one day, someone in a group asked if anyone thought that Phi had any relationship to the expansion of the universe.
I didn’t think so, but I was reminded of Phi as a value for correlation of proportional relationships of self-symmetry in systems (e.g. phyllotaxis and Phi … deep dive / shallow dive), and so I literally just grabbed the star radius data that I had, flipped on phi, set a series of powers ranging from 0 to some high number and ran the set.
I didn’t expect anything; it was more just a curiosity. When the astrosphere radius kept popping up at Phi^21, that’s when I got interested. When I asked, “Why 21?”, I decided to check the stuff between 21 and 0 … well … the only thing between a star and the astrosphere is mostly … planets. So, I collected a bunch of data on planetary orbits and went about checking and that’s when I found the sympathy with those and this Phi approach.
But until now, I hadn’t bothered to swing around and actually check where it all started; back at the atoms.
And, at this point a bit unsurprising to myself, it holds there just as well.
Anyway…I’m rambling.
Just geeking out on a hobby.
(btw, if you’re reading along and a bit math savvy…yes, the R^2 values are just the Pearson Correlation multiplied by itself.)
Cheers,
Jayson